Project
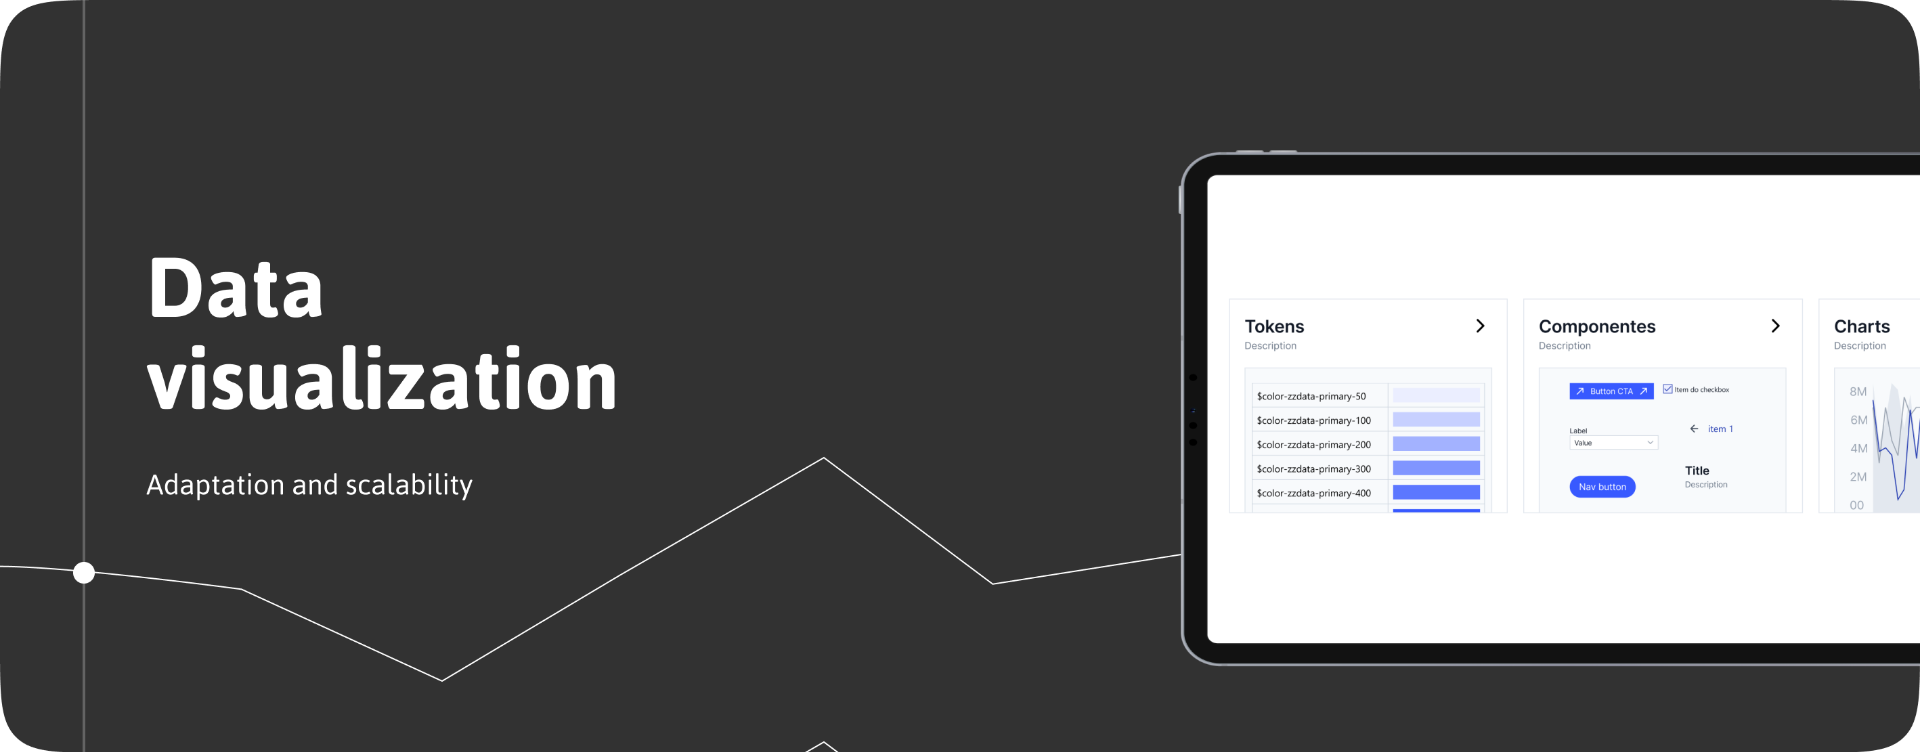
Design System for Data Visualization
Role
Design | Leadership project | Documentation
The data department at Arezzo & Co, part of the largest fashion retail group in Brazil, uses Tableau (Salesforce) as its primary data visualization tool. This platform is used across the company for internal analysis of revenue, sales, CRM, marketing, and other areas.
Due to its limitations in design customization, a design system approach was adopted to address these challenges.
Problems to be solved
- Inconsistencies in design and development standards
- Platform constraints impacting data visualization capabilities
- Challenges in implementing proposed design specifications
- Extended project delivery timelines

Tokens
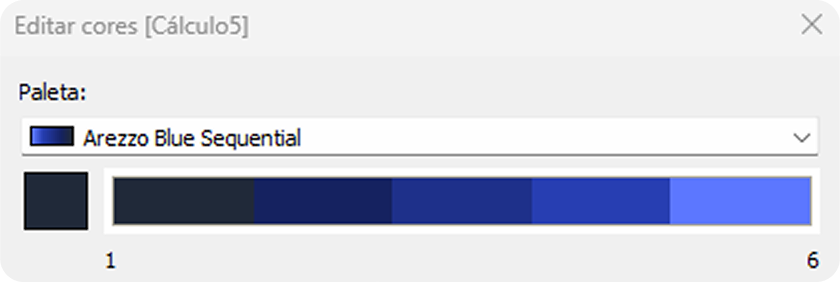
In Tableau, it's not possible to create a token library, but it's possible to save elements like colors and fonts as defaults in your projects.
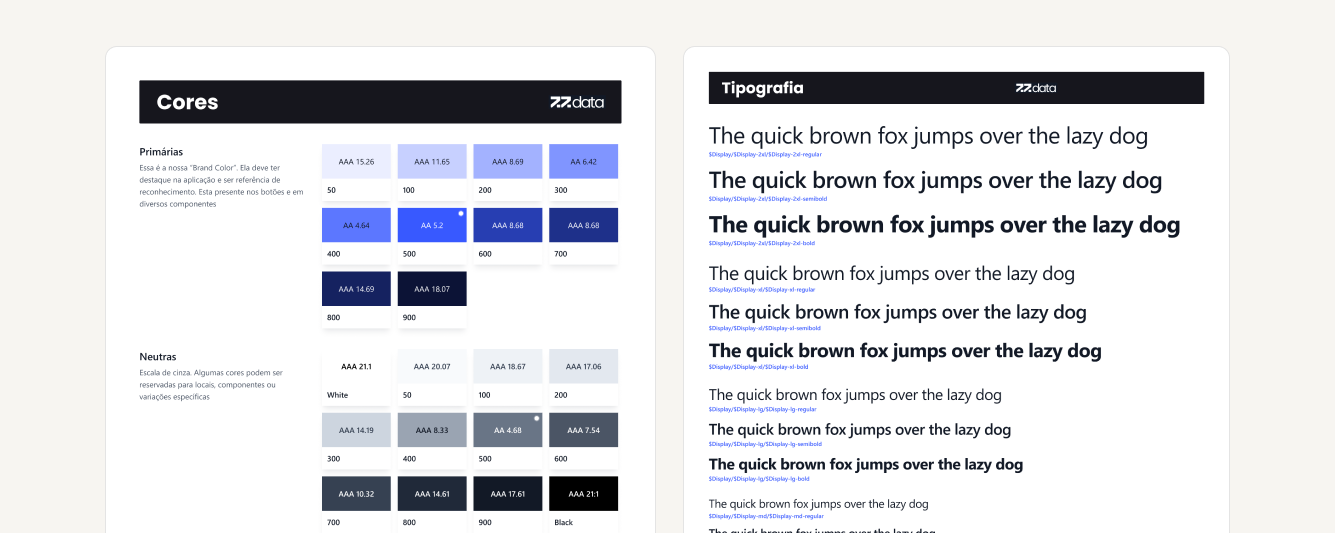
Components
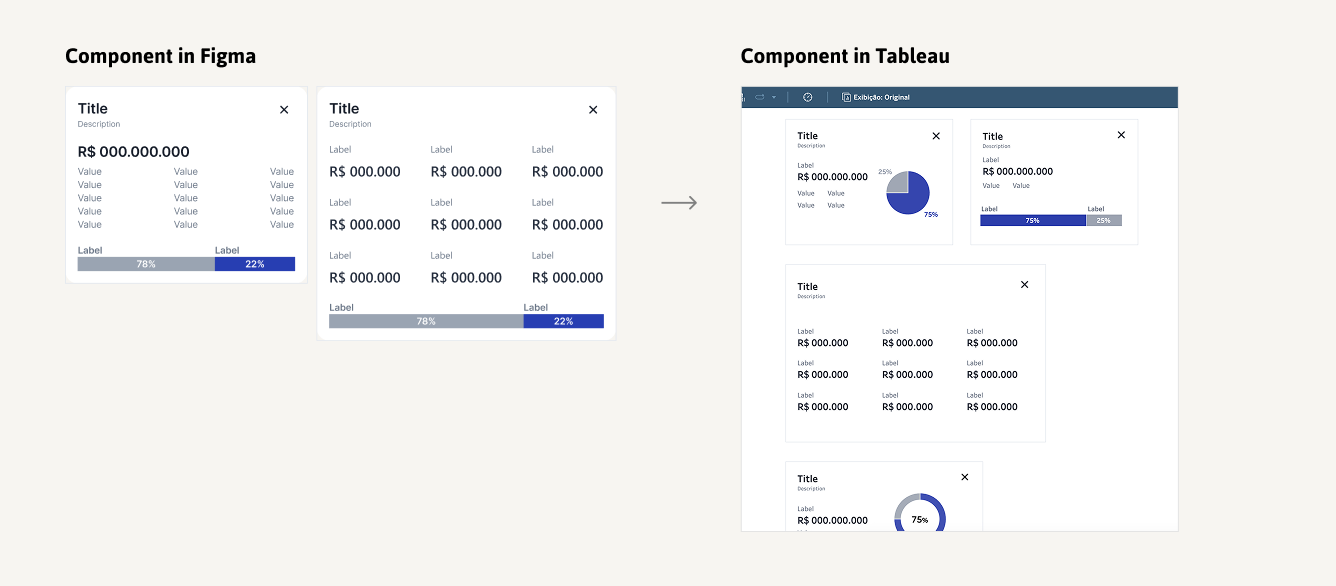
The design components were created following the usual model, and in Tableau, the elements were saved as "workbooks" — something similar to a template that can be saved and reused whenever needed.
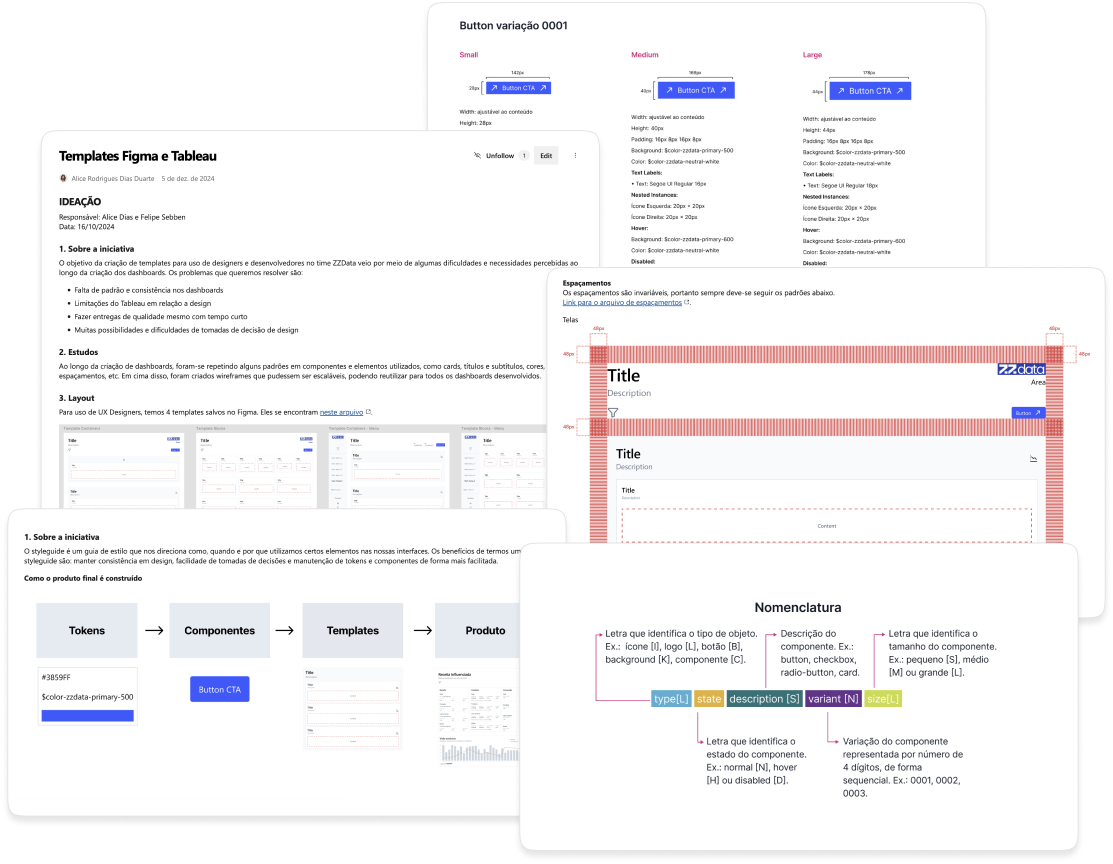
Additionally, some components need to be used as images in Tableau, so an image repository was created for organizing, reusing, and maintaining these images. For this purpose, the naming convention was important to indicate each element clearly.
Templates
The templates were built using block formats with predefined spacing, colors, and standard elements, but with flexible areas where any component could be inserted. This concept was developed for both design and implementation in Tableau.
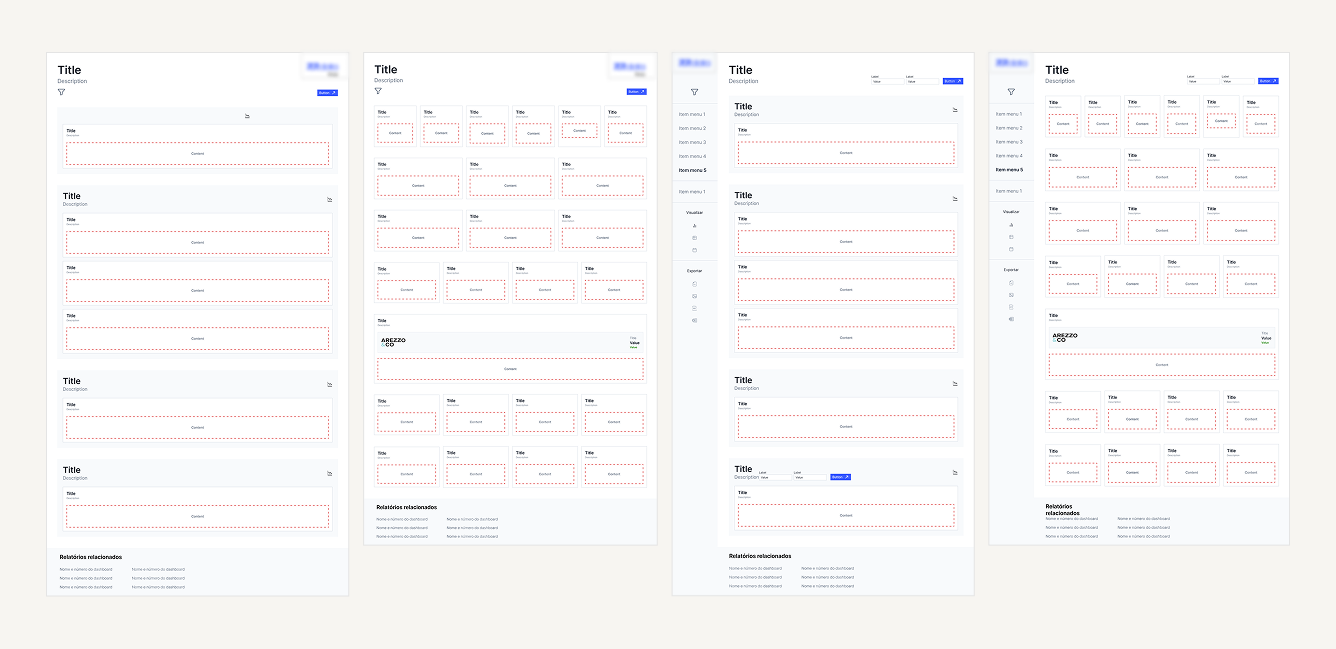
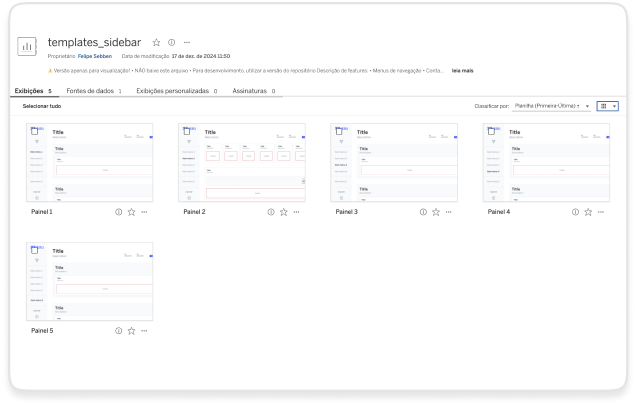
For functionality in Tableau, pages were created using the same blocks designed in Figma and saved as a dashboard panel. To use this template, the developer duplicates the template file and builds the dashboard or report based on that model.
Documentation
The documentation was created in Figma and in the company's internal documentation tool.
Main results
- Time reduction in design and development (estimated at 60%)
- Consistency in deliverables
- Dashboards with improved performance
- Interface recognition by users
- Reduction in usability errors